
In the last part we have learned how to setup the Anaconda environment and create a config file for the connection.
Afterwards we have opened the connection to FXCM, we have pulled the list of the available symbols and we learned how to get the prices for 100 candles for the currency pair AUD/CAD.
With matplotlib we plotted a little chart for those candle prices by using pyplot.
This time we actually want todo something with that price information and open a position.
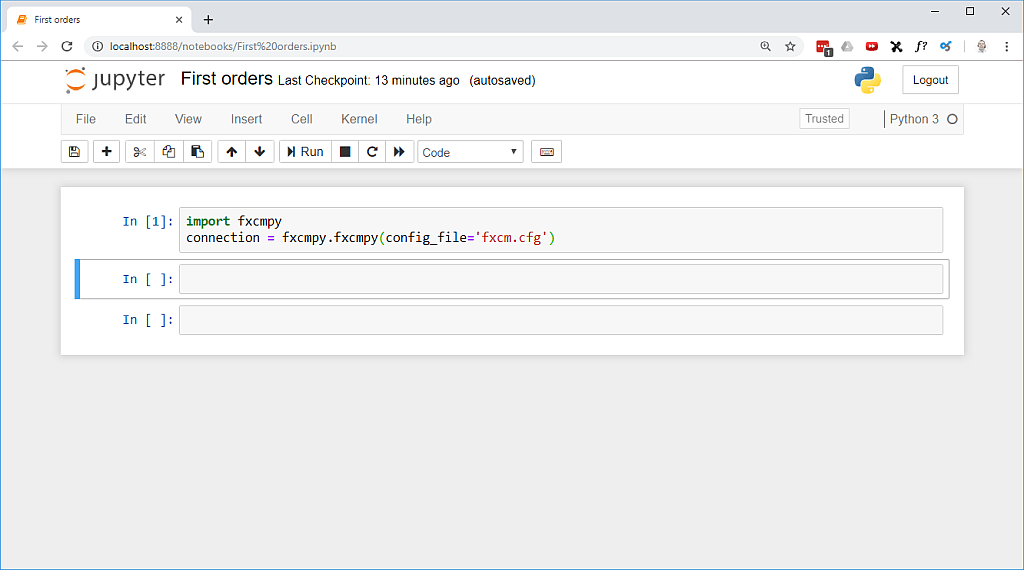
To get started I have already started the FXCMAPI environment and I have created a new jupyter notebook called “First orders”.
Now we need to import the API and create a new connection.
According to the documentation we can get a dictionary object for the orders with the following command.
As we have no open orders so far, it will not contain much, but it is a good way to check if your connection is already up and running.
connection.orders
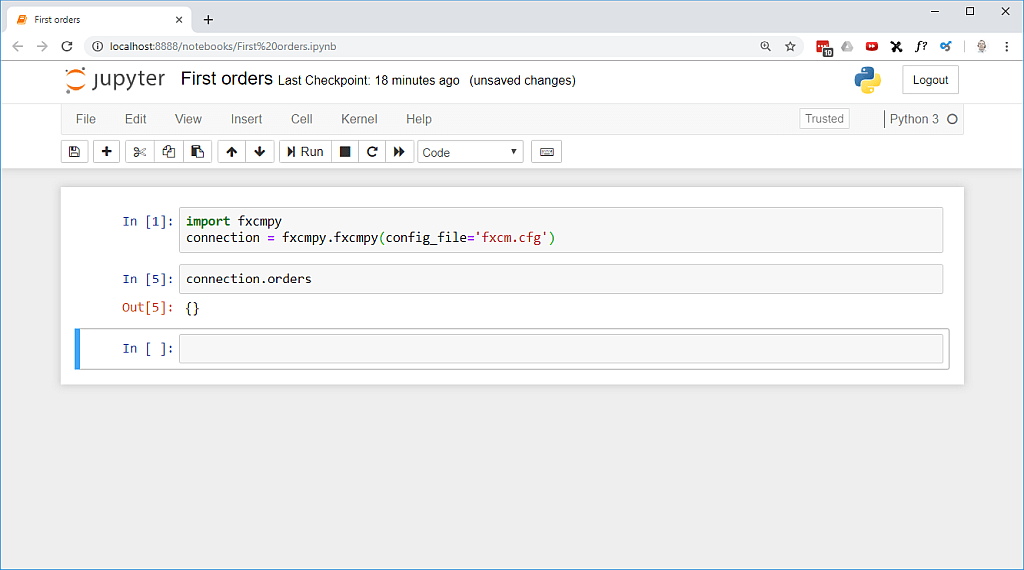
We get back two curly braces, so it seems to work.
So let’s try to find out how we can place a market order.
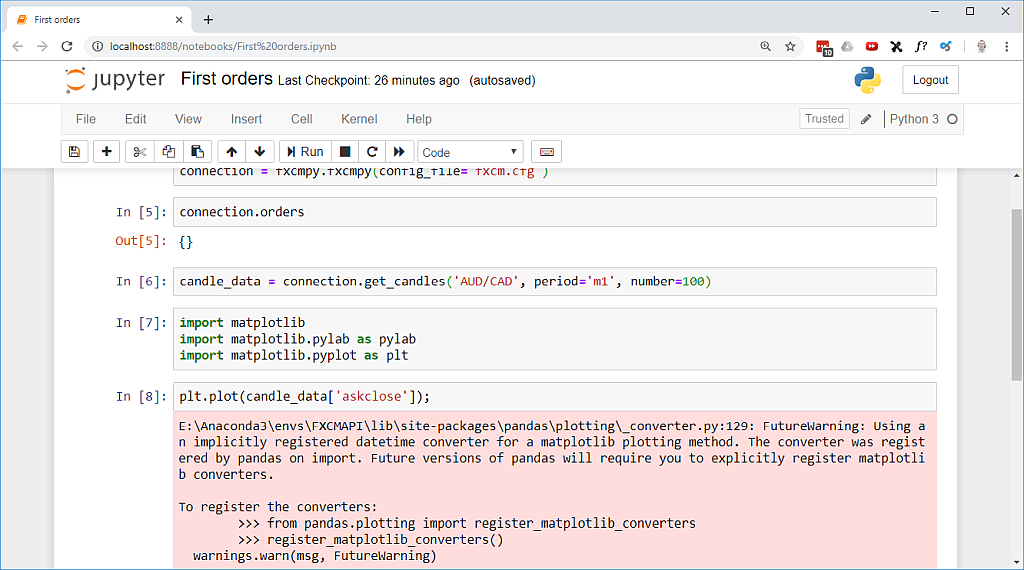
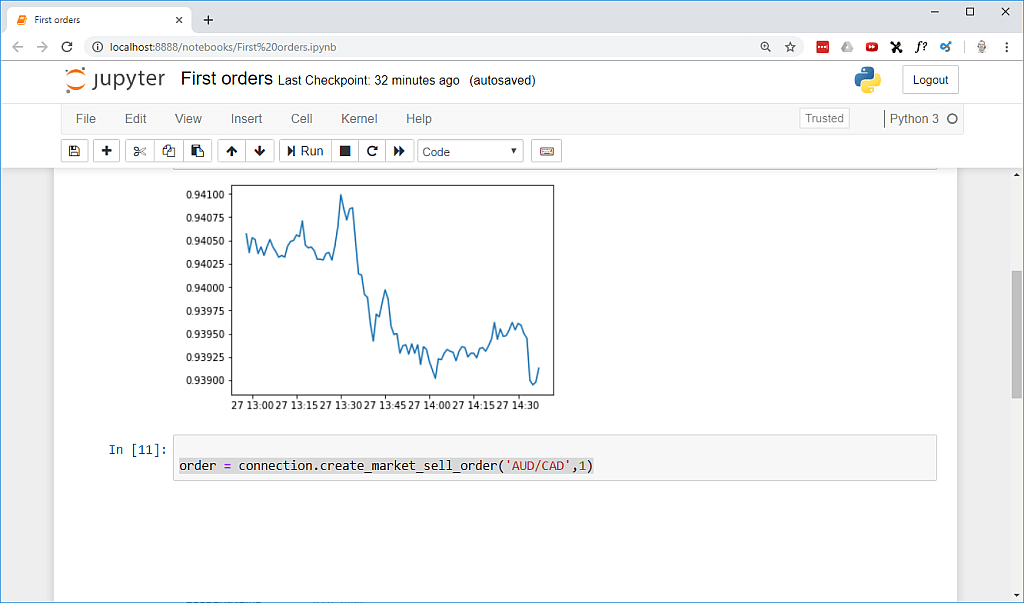
As we used AUD/CAD the last time, let’s plot that chart again.
We need to get the candle data for 100 candles on the 1 minute time frame, import the matplot lib modules and plot the chart.
Actually I get a warning that I will have to register matplotlib converters in the future.
But for now I can rerun the cell again and I get my chart output.
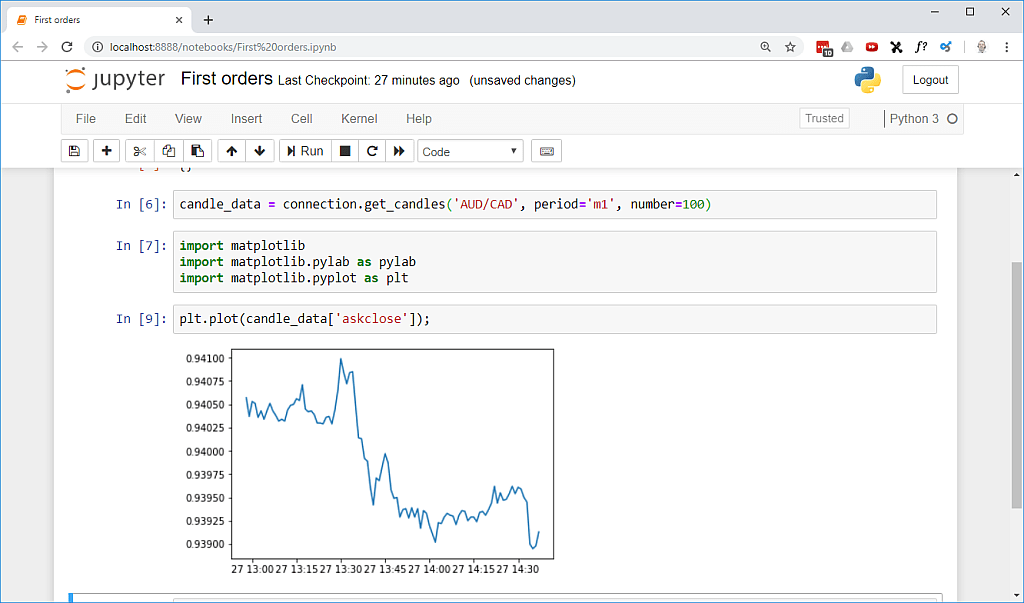
This looks like the price is falling, so I want to place a sell order. There is a simple way to do that by using the following command.
order = connection.create_market_sell_order(‘AUD/CAD’,1)
As there is no confirmation output, I want to get the details and it should work with the following command.
connection.get_open_positions().T
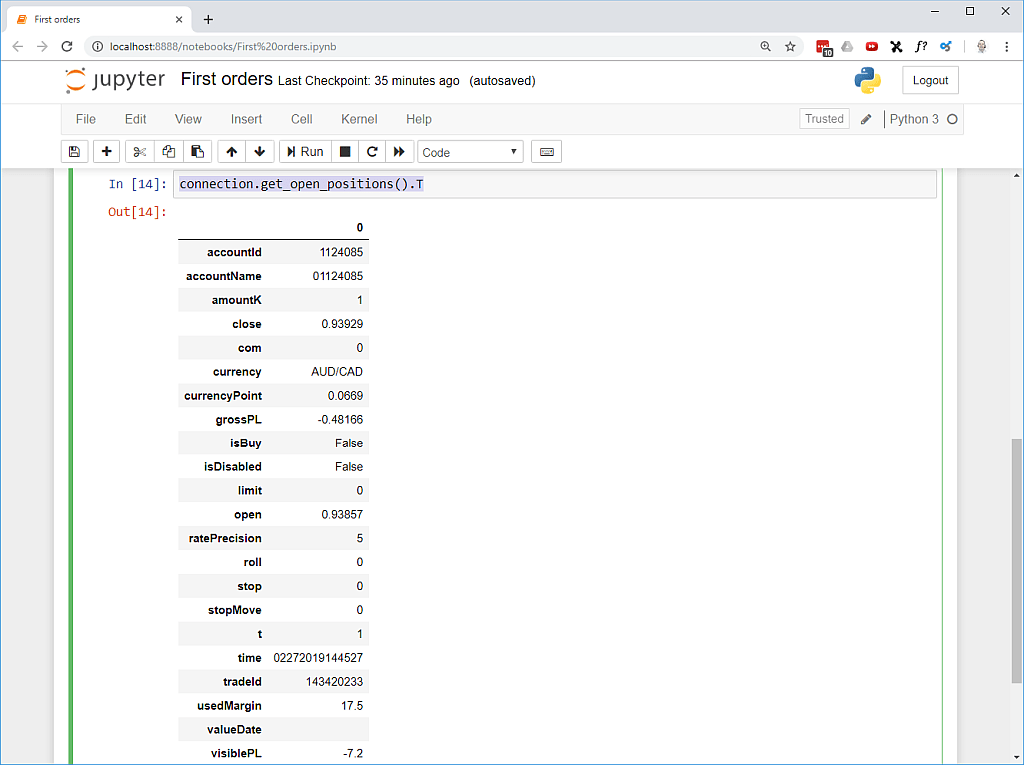
Indeed we have opened a position for the currency pair AUD/CAD. But what is all the information in the output?
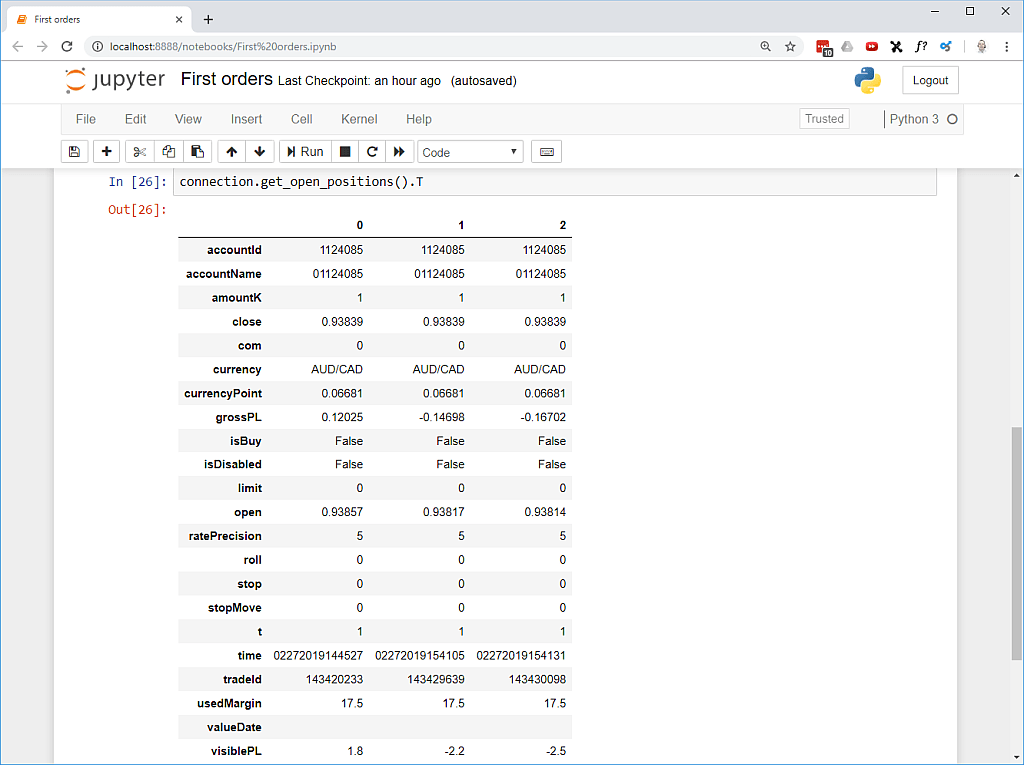
After I have opened two more sell positions my table shows three entries.
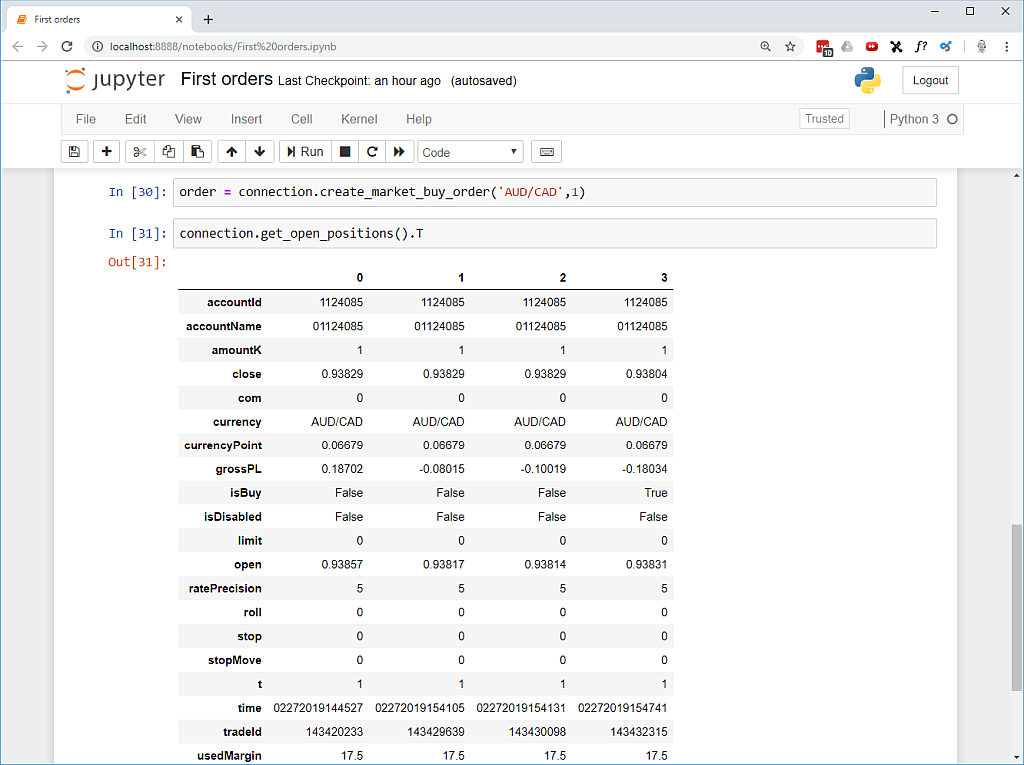
To complete this part I will also open a new buy order, it should be similar, so I just exchange the term sell and replace it with buy.
Afterwards my table shows a fourth column, this time the value for “isBuy” shows the value True, so it seems to work.
Conclusion: Opening buy or sell positions is not very hard with this FXCMAPI, but at this point I have a lot of open questions to cover.
How can I pick one of the positions and get the profit?
How can I change the size or close a position?
What are all those values in the table good for?
And I guess for the next few parts I have to find a better solution, because these jupyter notebooks do not seem to be the best way for me to do more advanced stuff.
So I guess I will try to use the Spyder IDE that is also included in the Anaconda distribution.
But one step at a time. In this part we have learned how to connect to the FXCMAPI and how to open buy and sell positions.
There is a more advanced way to do this, but we are going to cover that later. For now I am satisfied with the results.