Okay, by now we have learned how to install the Anaconda environment, how to use jupyter notebooks, how to create an environment in Anaconda, how to get an API connection token from FXCM and how to connect to FXCM with that token.
They recommend to use a configuration file to hide that token, so let’s try that.
First I need to start the Anaconda prompt and type in
activate FXCMAPI
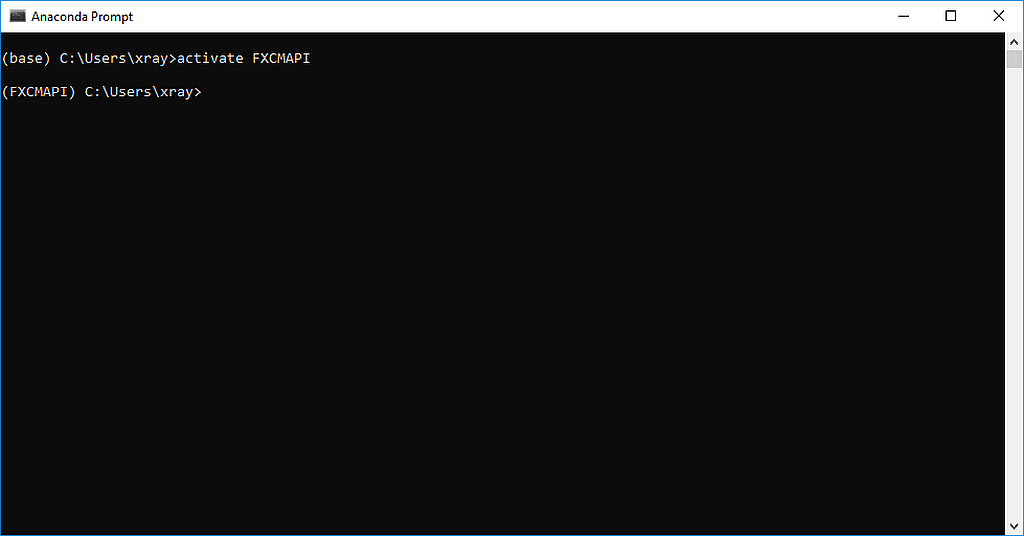
Now I have activated the environment that we have created before. Now I need to find out how I can create that configuration file.
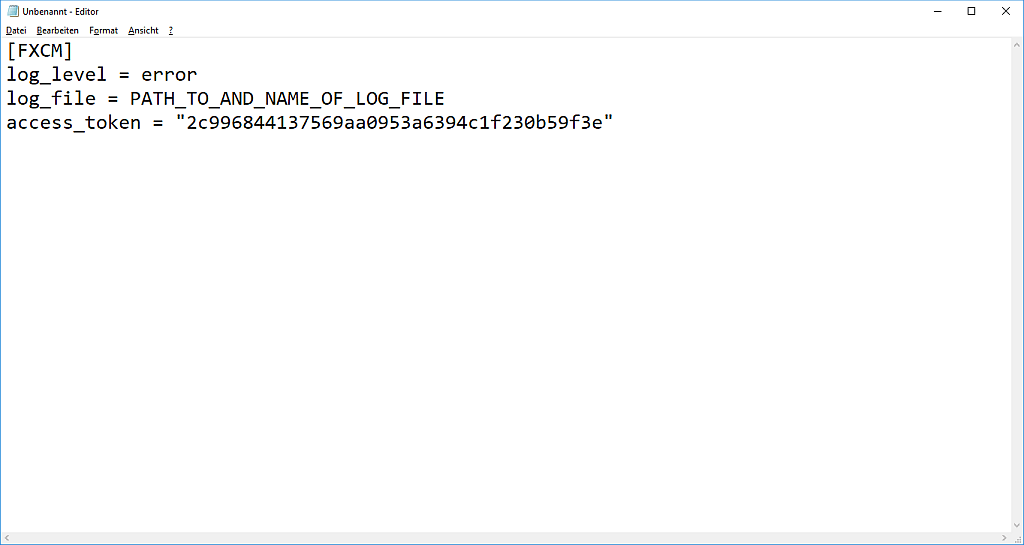
In the documentation you can find an example, so here is my version of that file. I used notepad to create it.
So lets start a new notebook called First steps and find out if fxcmpy still is working. Just output the version.
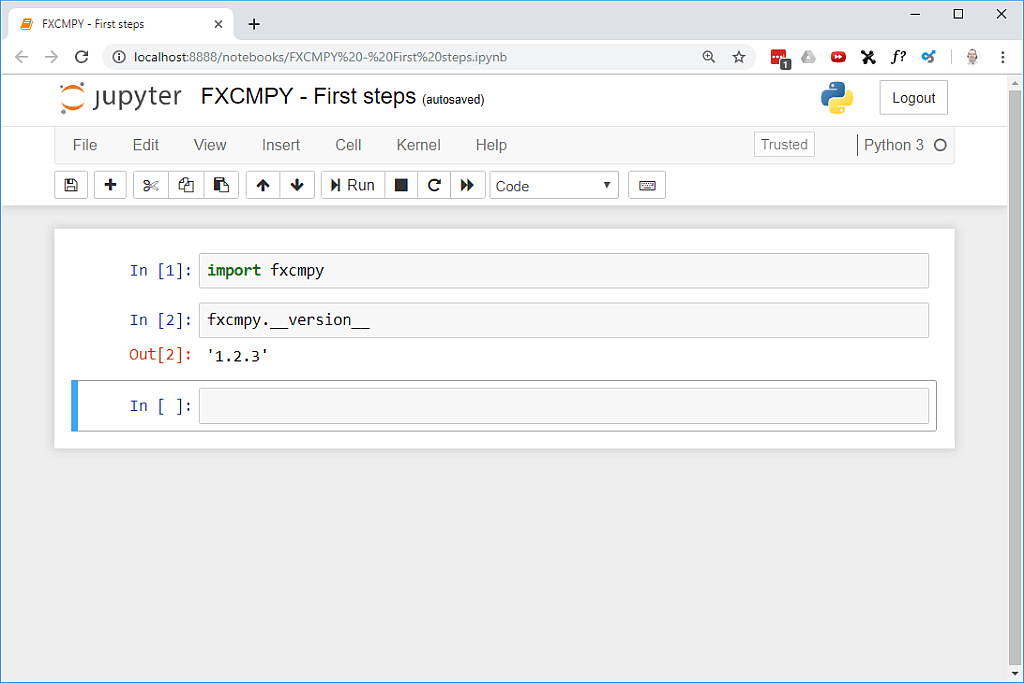
Once again, the token is modified in the screenshots, as I am going to use it for my own trading with FXCM and Python.
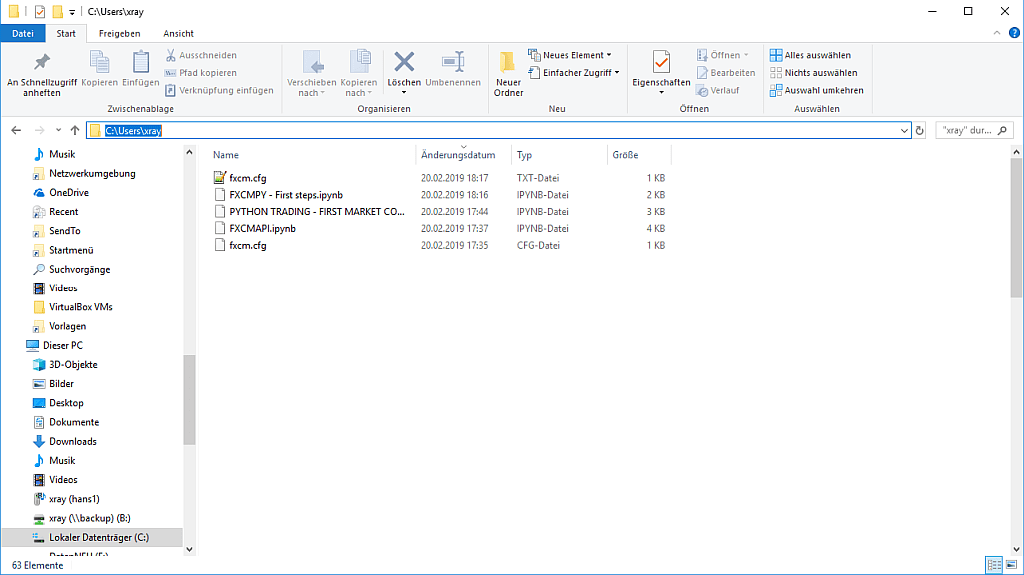
Now where do I need to store that file? The API documentation says that I need to put it into the “current working directory” and that it should be named fxcm.cfg.
So let’s find out where that directory is by using the command pwd. In my case it is my home folder on my windows 10 computer.
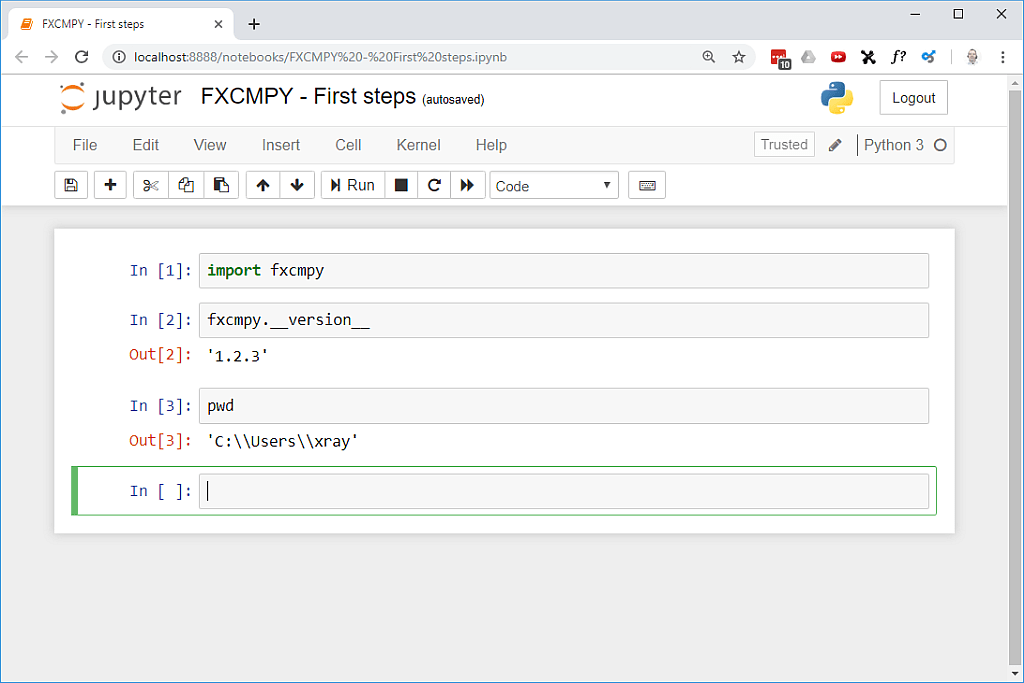
So I am going to safe it as fxcm.cfg in that folder, the complete path is c:\Users\xray in my case.
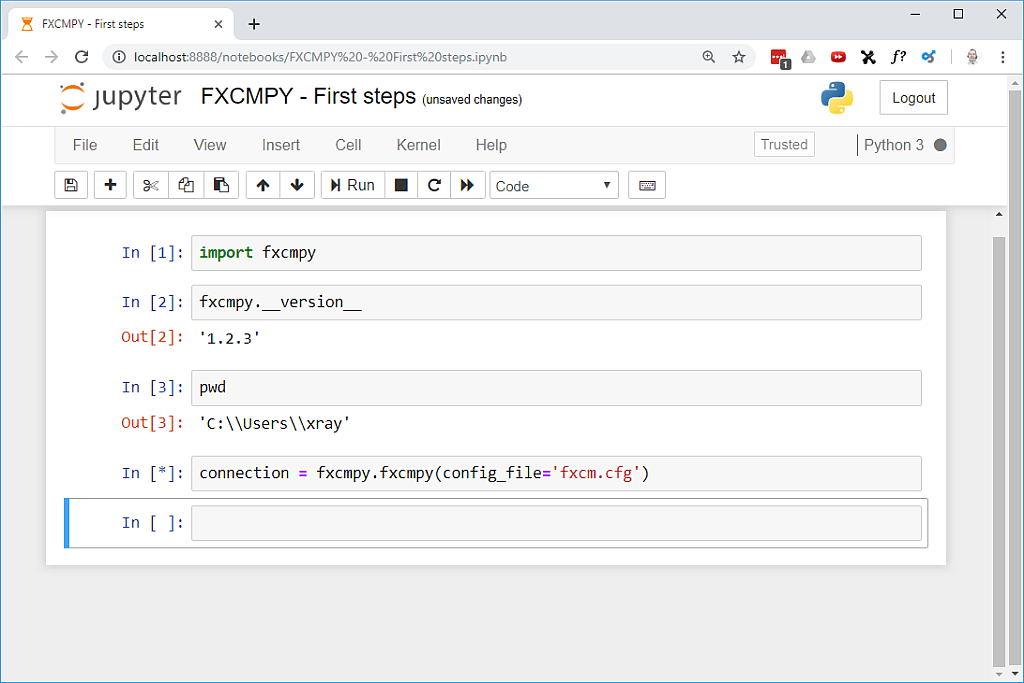
Now we should be able to establish a connection with that file. So let’s try that. The command to do it is connection = fxcmpy.fxcmpy(config_file=’fxcm.cfg’)
It seems to work in my case. At least it doesn’t produce any errors.
To find out if the connection is really working, I will try to get the list of the available currency pairs. According to the documentation that can be done by using print (connection.get_instruments()). So let’s find out if we get a list…
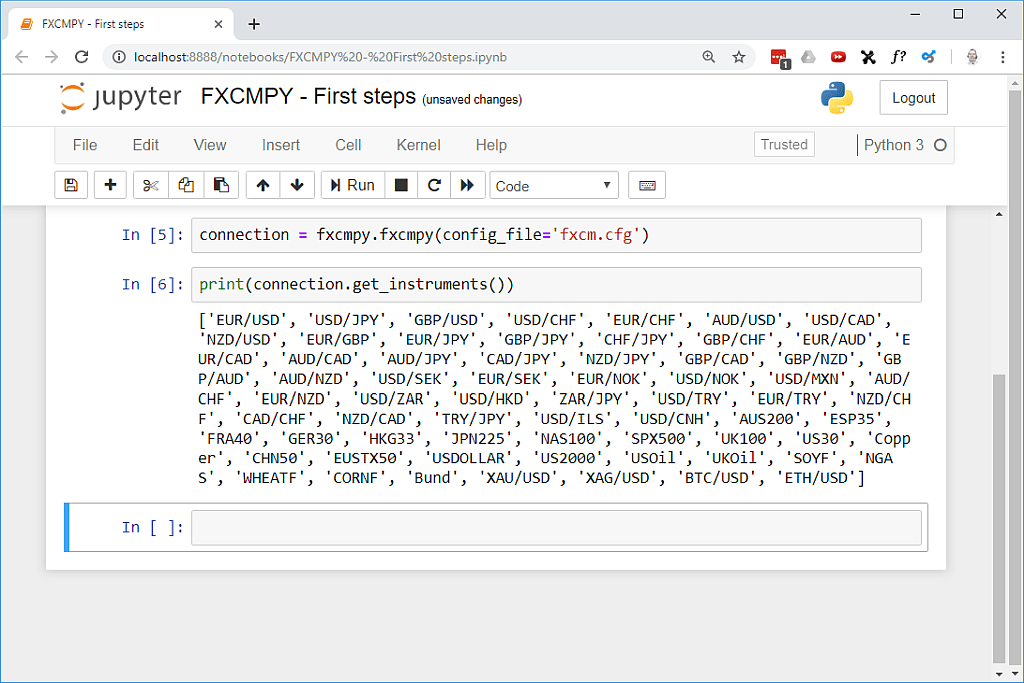
For several seconds nothing happens. In my case it took about 15 seconds before I got the list. That is pretty slow, but for now this should not be a problem as we are still in the total infancy stage.
So what is next? Let’s try to get some candle data by using the connection.get_candles() command.
It takes a few parameters. The first parameter is for the currency pair, the second parameter is for the time frame and the third parameter is for the number of candles we want to output.
So let’s try to get one hundred candles for AUD/CAD, I would like to have a one minute timeframe as I am used to trade 1-minute charts with MQL4 and MQL5.
The command to do that is
candle_data = con.get_candles(‘AUD/CAD’, period=’m1′, number=100)
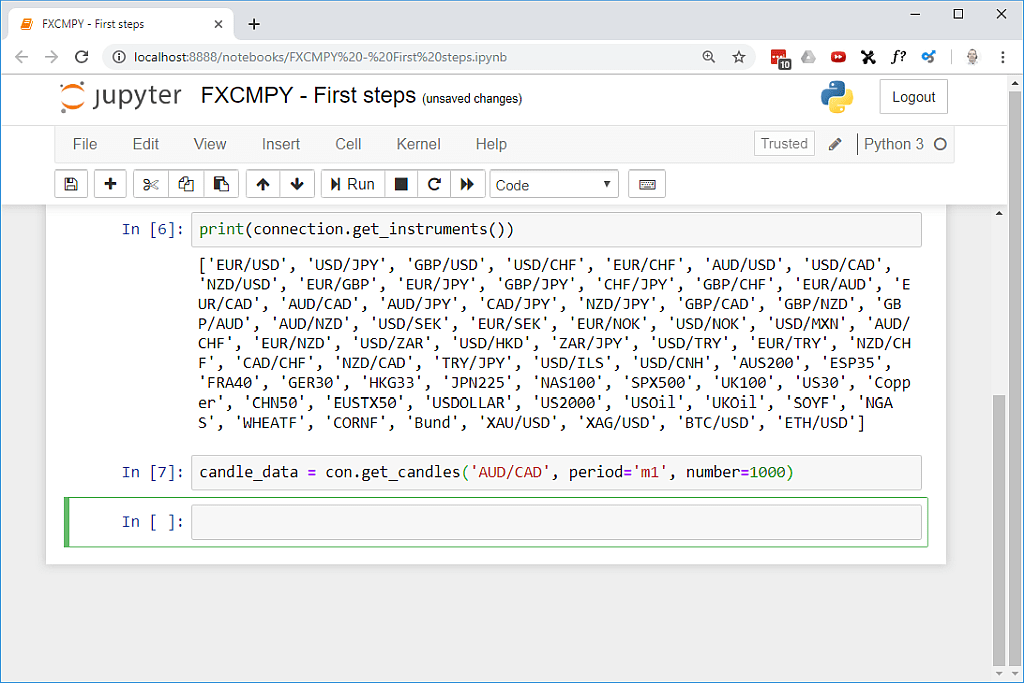
No errors, but also no output. I would like to see a chart, that seems to be not so hard as the documentation has an example that we can adapt for our purposes.
So let’s install matplotlib in our environment by using the command pip install matplotlib. This will take some time.
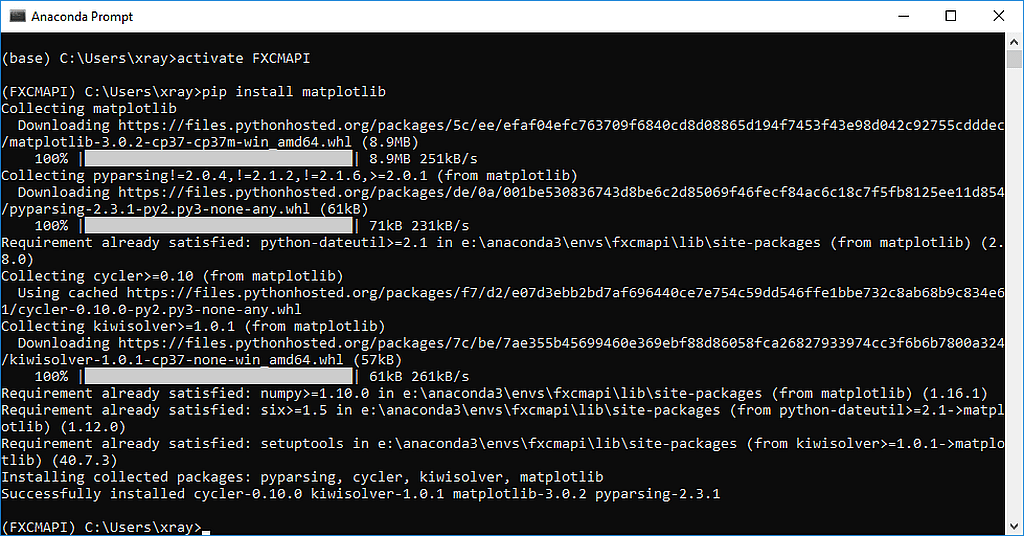
Afterwards we want to import matplotlib and matplotlib.pyplot. The command to do that is shown below.
import matplotlib
import matplotlib.pyplot as plt
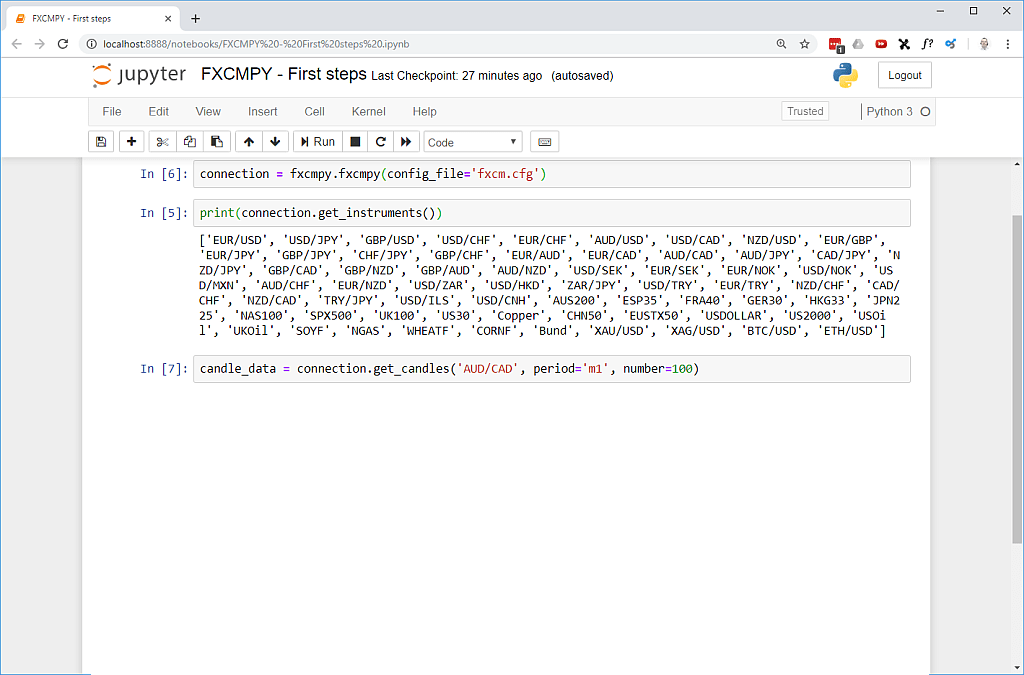
And now, finally we can use matplotlib to create a chart with the data for our 100 candles. I would like to see the askclose price data.
To create that chart, we use the command below.
plt.plot(candle_data[‘askclose’]);
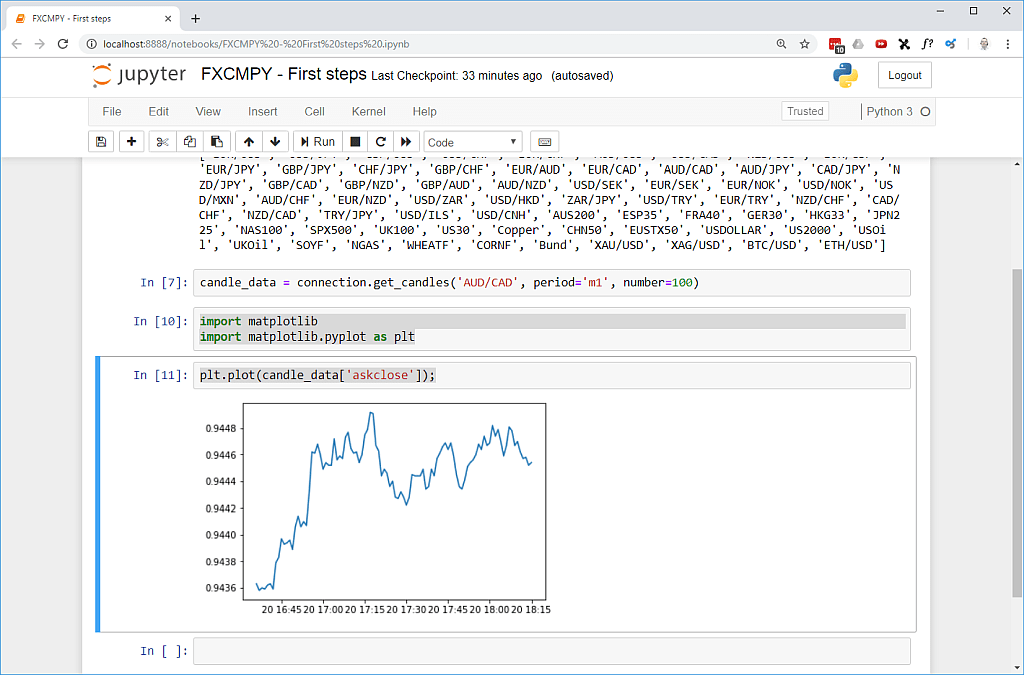
So that was it. In this part we learned how to store the API connection token in a file that can be imported by a jupyter notebook. We have also created a connection and listed all the available symbols.
Afterwards we used the connection to import candle data for AUD/CAD, installed matplotlib and used matplotlib to draw a chart for 100 candles, right inside of our notebook.
All this took us only a few minutes and a few lines of Python code. I admit, I really start to like Python, because this was pretty easy.
I also need to admit that the documentation for the matplotlib chart did not work for me. I had to google and read several forum threads to make it work.
But isn’t that the reason why beginner tutorials like this one are so popular?
